As the world amasses ever more data, there's the lingering question of how exactly we should be using it. Researchers believe that big data could hold the answers to many of our social problems, providing insight into everything from the things that are making us sick, to how to help curb our energy usage. But first we have to figure out how to visualise it all.
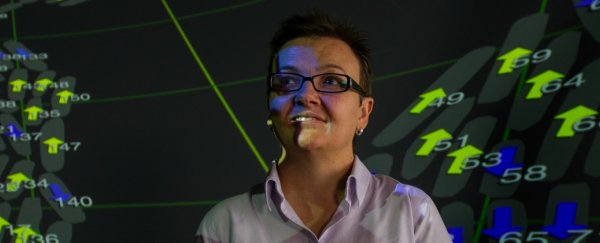
So the University of Technology, Sydney (UTS) has launched a new virtual reality theatre, which allows researchers to visualise all the mind-melting data out there on the interwebs in beautiful neon pictures and animations.
"As we're getting into bigger and bigger data, it becomes more and more important to figure out what we've got," lead developer Ben Simons, a graphic designer who's worked on films such as Happy Feet Two, said in a press release. "The way to make sense of all this big data is to visualise it."
Known as the Data Arena, the goal of the theatre is to help researchers monitor changes in their data, so they can find new patterns and correlations in the numbers. It will also be open to the public, and Simons has made all the software open-access, with the ultimate goal of making the Data Arena virtual and accessible from anywhere in the world.
Right now, the visualisations are housed inside a pitch black, soundproof, cylindrical room, to impart the feeling of actually stepping inside the data. Think Professor Charles Xavier's Cerebro room in X-Men, except without the mental link.
The Data Arena doesn't just turn numbers into pictures, it also lets researchers, students, and artists visualise tiny things - such as the structure of skin cells or the stitching on a garment - in life-size, which they can then interact with using a hand-held controller.
UTS Science's microbiologist Cynthia Whitchurch, has already used the room to watch the bacteria she studies, called Pseudomonas aeruginosa, move as larger-than-life images. P. aeruginosa are a common cause of hospital infections, and usually her data on how they spread is represented by thousands of numbers on her computer screen.
But she's now been able to create a movie of her data, and visualise the communal and individual movements of bacteria across a surface. "They're actually gouging out their own network of roadways," said Whitchurch. "It really is a lot like smooth traffic flow."
Find out more about the Data Arena or studying science or mathematics at UTS.
