Jupiter: king of the planets, protector of the inner Solar System. We all know what the gas giant looks like, with its vanilla and butterscotch ice-cream bands of counter-rotating cloud, and the iconic red storm raging in the southern hemisphere.
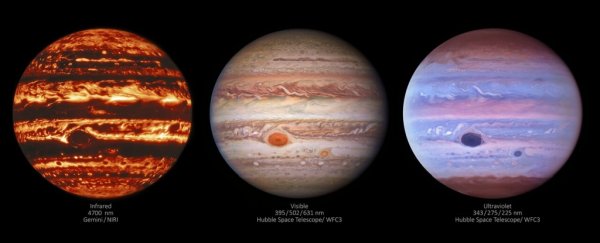
But that's only how Jupiter looks in optical wavelengths, though. When imaged in wavelengths beyond the limits of human vision, Jupiter appears differently. In infrared, thermal emission glows brightly, with cooler regions duller red (a bit like lasagna); in ultraviolet, soft, cotton-candy pastels show us different altitudes.
These different wavelengths, showing such very different faces of Jupiter, are the subject of a new image release from the National Science Foundation's National Optical-Infrared Astronomy Research Laboratory (NOIRLab), showcasing how multi-wavelength astronomy can provide us with a holistic dataset revealing complexities that can't be seen in one wavelength alone.
 Jupiter in infrared. (International Gemini Observatory/NOIRLab/NSF/AURA, M.H. Wong (UC Berkeley) et al./M. Zamani)
All three observations were taken at the same time, at 15:41 UT on 11 January 2017. The Hubble Space Telescope handled the optical and ultraviolet wavelengths, using its Wide Field Camera 3. The ultraviolet image was taken by the Gemini North telescope's Near-Infrared Imager.
The result is a rare snapshot of Jupiter at a single point in time across a wide swathe of the electromagnetic spectrum, and the differences between the images are fascinating.
Visible light, for instance, allows us to see details on the surface of Jupiter's atmosphere, but it's impossible to gauge how thick the cloud layers are. When we view the planet in infrared, vivid streaks of gold indicate thinner regions, allowing thermal energy from below the atmosphere to shine through.
 (NASA/ESA/NOIRLab/NSF/AURA/M.H. Wong and I. de Pater (UC Berkeley) et al./M. Zamani)
The Great Red Spot, so vivid in visible light and ultraviolet, practically disappears in infrared, only discernible by its outline, and a thin crack in the cyclone's otherwise thick cloud. Its smaller storm buddy, 'Red Spot Jr.' (AKA Oval BA), disappears entirely.
Ultraviolet imagery of Jupiter helps scientists track the altitude and distribution of particles in the atmosphere. Higher layers, for example, appear redder due to the absorption of ultraviolet light at high altitude, whereas bluer regions appear so because of the reflection of ultraviolet light at lower altitudes.
These images, when combined with visible light, show where Jupiter's chromophores are concentrated, too. Those are the particles that produce the red color seen in the Great Red Spot and Red Spot Jr.
 Jupiter in ultraviolet. (NASA/ESA/NOIRLab/NSF/AURA/M.H. Wong and I. de Pater (UC Berkeley) et al./M. Zamani)
Scientists have already been using images such as these to learn more about Jupiter. In 2019, a team of scientists compared Hubble observations with radio observations from the Atacama Large Millimeter/submillimeter Array to find out what's happening inside Jupiter's storms.
Gemini, Hubble, and Juno observations appeared together in a study last year, finally revealing that the darker streak in the Great Red Spot was in fact a streak of thinner cloud, as well as the structure of the clouds where lightning strikes - the latter detected as radio signals by Juno. This research is also the subject of a new NOIRLab blog post.
The three instruments are going to continue to be working together for some time. In January of this year, NASA announced that the Juno mission is to be extended - instead of its previously scheduled conclusion in July of this year, it will remain in operation until at least September 2025, if the spacecraft doesn't break down before then.
Since arriving in Jovian orbit in 2016, Juno has already given us so much new information on Jupiter that we're going to be processing and learning from it for years to come. We can't wait to see what else multi-wavelength observations can teach us about this incredible planet.
Especially if it's going to keep looking like such a snack.
Image credit at top of story: (International Gemini Observatory/NOIRLab/NSF/AURA/NASA/ESA, M.H. Wong and I. de Pater (UC Berkeley) et al./M. Zamani)
