Many papers are usually released at once for big space exploration missions. Usually, that happens when an entire batch of data has been analyzed.
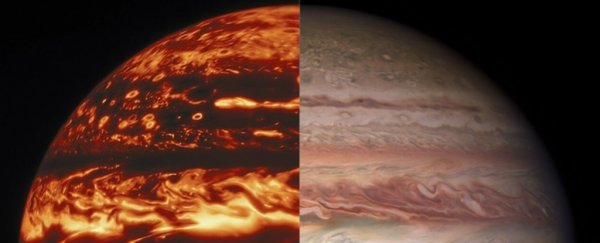
The most recent set of papers is from Juno's explorations of Jupiter's atmosphere. With this data dump, scientists now have the first 3D map of the atmosphere of the Solar System's largest planet.
Four main discoveries were highlighted as part of NASA's press release of the set of papers.
The first is that there are systems in Jupiter's atmosphere similar to "Farrell cells," which we covered in a previous UT article.
Another has to do with one of the most famous of Jupiter's features: the Great Red Spot.
Discovered over 200 years ago, the Great Red Spot is one of the most fascinating parts of Jupiter's atmosphere. Larger the Earth's diameter, up until now, there had been no indication of how deep this enormous "anticyclone" protruded down into the atmosphere.
Juno shed some light on the situation, but only as it flashed past at 209,000 kilometers per hour (130 miles per hour).
Luckily it got to do so twice, and during those flybys, the probe turned its microwave radiometer (MWR) towards the towering atmospheric structure.
Designed to look beneath Jupiter's clouds, MWR was able to tell that the Great Red Spot extended between approximately 300-500 kilometers (200-300 miles) down into the gas giant's atmosphere. More minor storms only reach about 60 km (40 miles) into the clouds, making the mother of all anticyclones even more gigantic than initially thought.
That giant atmospheric feature is only one of Jupiter's well-known patterns in its atmosphere, though. Another – its distinct "belts" of certain colored clouds – are formed by powerful winds blowing in opposite directions for each belt. In addition to creating the Ferrel cells mentioned above, the belts are hiding another secret below the clouds – they have transition segments very similar to a phenomenon known as thermoclines here on Earth.
Thermoclines occur where dramatic temperature changes occur in bodies of water, usually Earth's ocean. They are visually noticeable from their distinct optical properties, where the two temperatures of water appear very visually distinct from one another. Jupiter's analog, named a Jovicline by its discoverers, is similar in its changing optical properties.
The belt is exceptionally bright in MWR's data at shallow depths into the atmosphere compared to surrounding systems. However, at deeper levels, the surrounding systems show up as brighter rather than the belt itself. Thermoclines have similar properties, with warmer water and colder water reflecting different wavelengths of light differently.
MWR wasn't the only instrument trained on Jupiter during Juno's 37 flybys so far.
The Jovian Infrared Auroral Mapper (JIRAM) was also collecting data, and in particular, spent time looking at cyclones located near the planet's poles. Eight distinct storms form an octagon near the north pole, while five distinct storms form a pentagon in the south.
Typical atmospheric modeling would have one of the cyclones pulled poleward. However, there are cyclones at the center of each pole that negate that pull, leaving each storm stuck in the same pattern for years at a time.
Juno will have plenty more years to assess those storms and other features of Jupiter and some of its surrounding moons as it continues its second extended mission well into 2025.
With luck, the spacecraft can go for a third extended mission more than 16 years after it initially launched.
This article was originally published by Universe Today. Read the original article.
